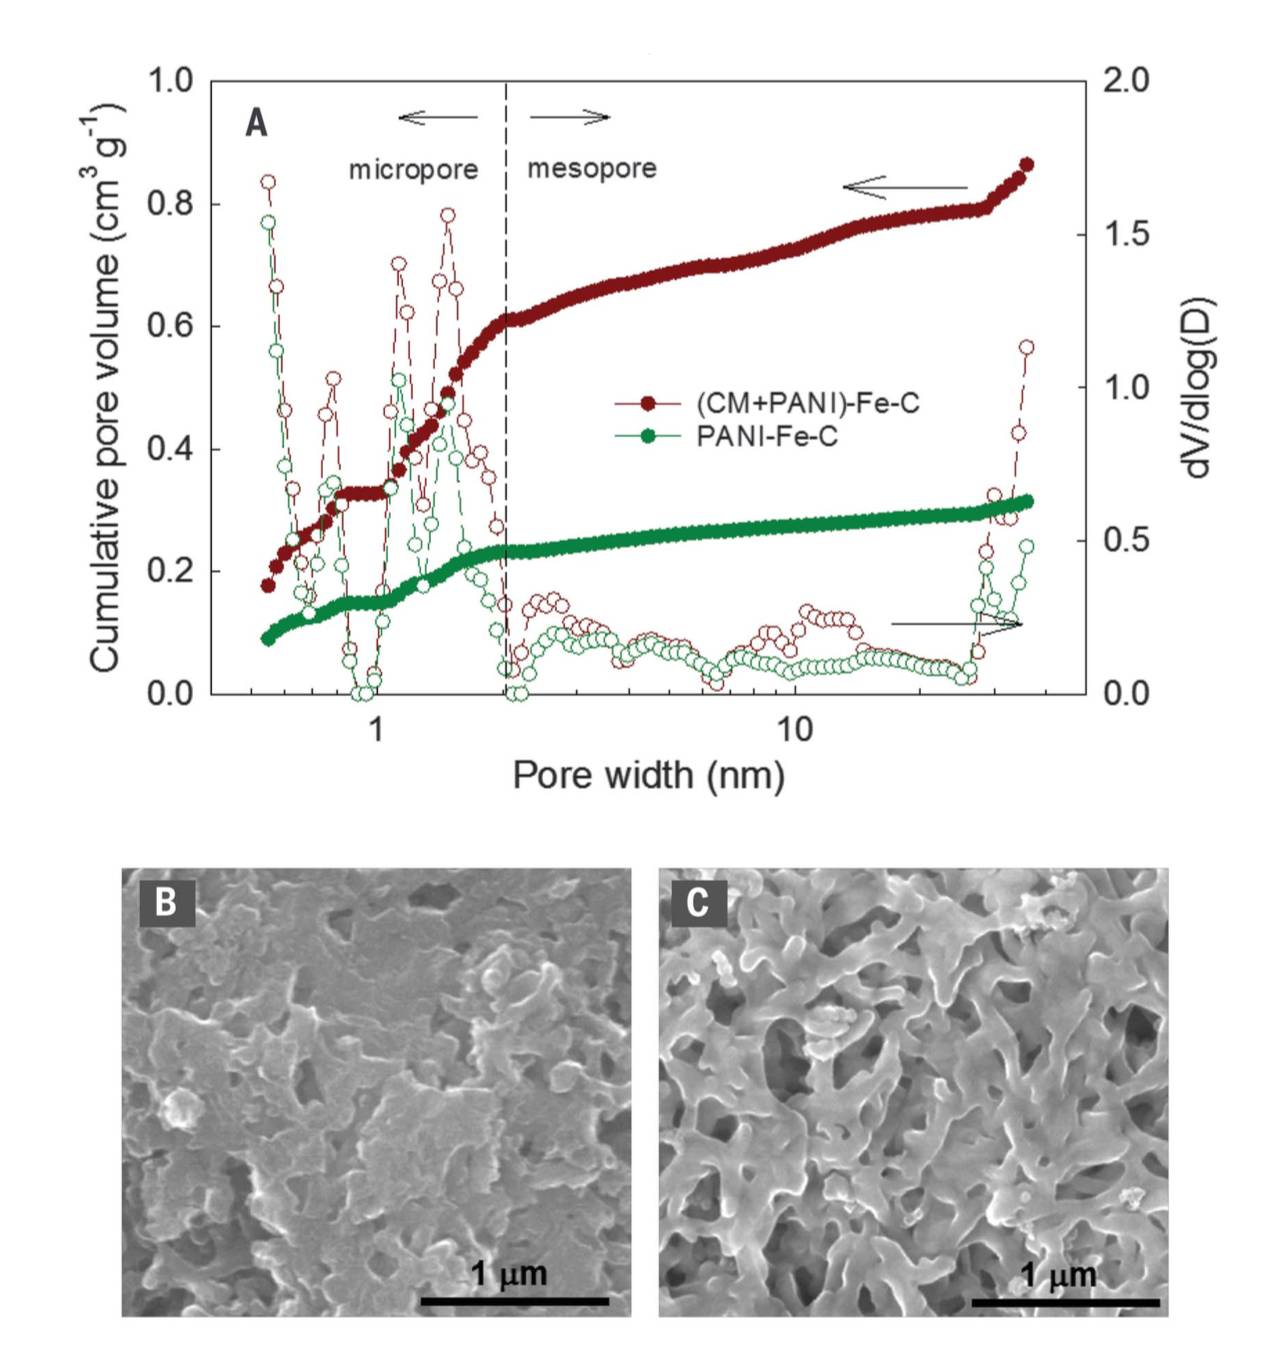
Fig. 1. Hierarchical pore structure. (A) Micropore and mesopore size distributions. The micropore size distribution had peaks associated with three pore widths: 0.8, 1.1, and 1.5 nm. dV/dlog (D) is the differential pore volume distribution, where V is pore volume and D is pore diameter. (B and C) SEM images of PANI-Fe-C and (CM+PANI)-Fe-C catalysts, respectively, demonstrating the effect of CM in macropore formation.

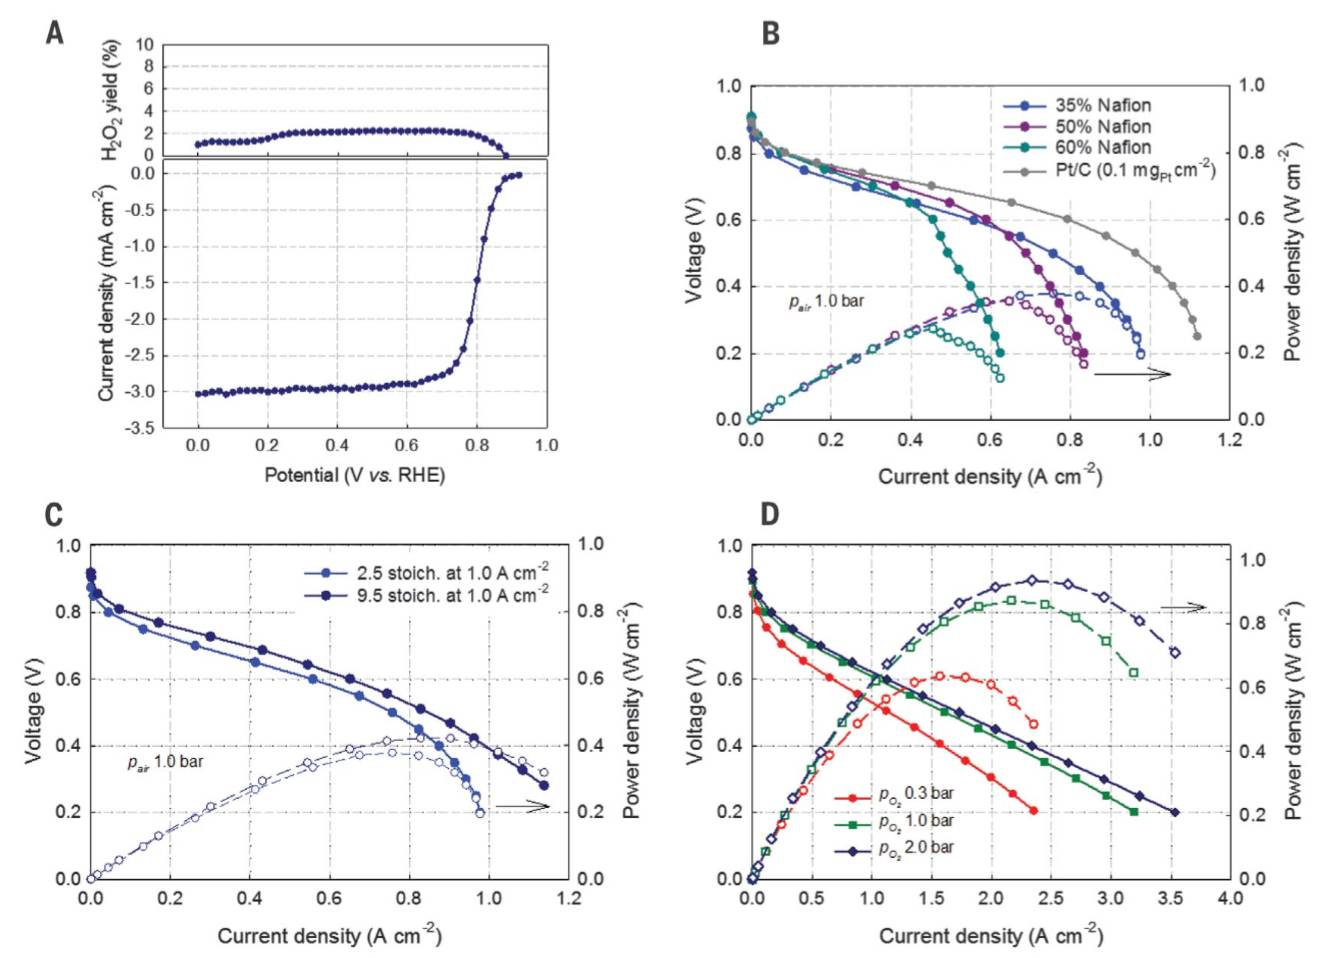
Fig. 2. Electrochemical and fuel cell performances. (A) ORR performance of (CM+PANI)-Fe-C catalyst. Steady-state RDE polarization plots were obtained by using a 20-mV potential step and 25-s potential hold time at every step. Electrolyte 0.5 M H2SO4, temperature 25 ± 1°C, rotation rate 900 rpm. (B and C) H2-air fuel cell polarization plots. Cathode: ~4.0 mg cm−2 of (CM+PANI)-Fe-C; air 200 ml min−1 (2.5 stoichiometry at 1.0 A cm−2) and 760 ml min−1 (9.5 stoichiometry at 1.0 A cm−2); 100% relative humidity (RH); and 1.0 bar partial pressure. Anode: 2.0 mgPt cm−2 Pt/C; H2 200 ml min−1; 100% RH; and 1.0 bar partial pressure. Membrane Nafion 211, cell 80°C, electrode area 5 cm2. (D) H2-O2 fuel cell polarization plots. Cathode: ~4.0 mg cm−2of (CM+PANI)-Fe-C; O2 200 ml min−1 (40 ml min–1 cm–2); 100% RH; 0.3, 1.0, and 2.0 bar partial pressures. Anode: 2.0 mgPtcm−2 Pt/C; H2 200 ml min−1; 100% RH; 1.0 bar partial pressure. Membrane Nafion 211, cell 80°C; 5 cm2 electrode area. Fig. 2. Electrochemical and fuel cell performances. (A) ORR performance of (CM+PANI)-Fe-C catalyst. Steady-state RDE polarization plots were obtained by using a 20-mV potential step and 25-s potential hold time at every step. Electrolyte 0.5 M H2SO4, temperature 25 ± 1°C, rotation rate 900 rpm. (B and C) H2-air fuel cell polarization plots. Cathode: ~4.0 mg cm−2 of (CM+PANI)-Fe-C; air 200 ml min−1 (2.5 stoichiometry at 1.0 A cm−2) and 760 ml min−1 (9.5 stoichiometry at 1.0 A cm−2); 100% relative humidity (RH); and 1.0 bar partial pressure. Anode: 2.0 mgPt cm−2 Pt/C; H2 200 ml min−1; 100% RH; and 1.0 bar partial pressure. Membrane Nafion 211, cell 80°C, electrode area 5 cm2. (D) H2-O2 fuel cell polarization plots. Cathode: ~4.0 mg cm−2of (CM+PANI)-Fe-C; O2 200 ml min−1 (40 ml min–1 cm–2); 100% RH; 0.3, 1.0, and 2.0 bar partial pressures. Anode: 2.0 mgPtcm−2 Pt/C; H2 200 ml min−1; 100% RH; 1.0 bar partial pressure. Membrane Nafion 211, cell 80°C; 5 cm2 electrode area.

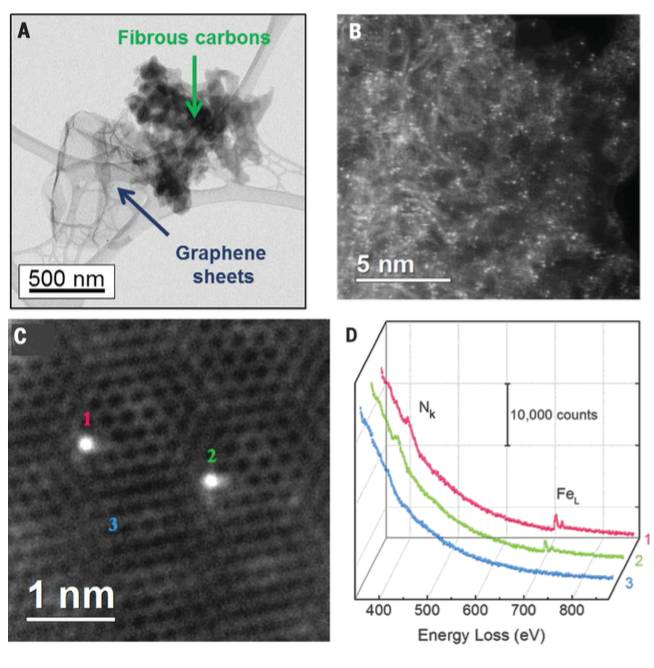
Fig. 3. STEM images and EEL spectra of the (CM+PANI)-Fe-C catalyst. (A) BF-STEM image of a typical (CM+PANI)-Fe-C catalyst showing primary fibrous carbons and secondary graphene sheets.(B) Atomic-resolution HAADF-STEM image of Featoms distributed across the surface of fibrous
carbon phase showing randomly oriented, intertwined graphitic domains. (C) HAADF-STEM image of individual Fe atoms (labeled 1, 2, and 3) in a few-layer graphene sheet. (D) EEL spectra of the N k-edge (Nk) and Fe L-edge (FeL) acquired from single atoms (1 and 2) and few-layer graphene (3), demonstrating the presence of N around the Fe atoms.

Fig. 4. Model structures used in theoretical studies with spontaneously formed OH ligand. Views from above (A and B), from side (C and D), and from tilted perspective (EandF). (A), (C), and (E) show bulk-hosted FeN4and (B), (D), and (F) show zigzag edge-hosted FeN4 structures with OH ligands. C, gray; Fe, bronze; H, white; N, blue; O, red.